22 Feb Customer churn: How many of your customers walked away last year?

Winning new customers is such a rewarding feeling. It’s a metric that’s consistently tracked and measured across every campaign or marketing initiative. What doesn’t attract as much interest is the analysis of customer churn.
Yes, the polar opposite to customer acquisition.
It’s rare that you will see customer churn reduction as a core objective on a marketing plan. Some brands prioritise it, but not many. But why not? Why isn’t this a core focus? If you had a leaking bucket, you wouldn’t continue to try and fill it – you would fix the leak! (Excuse the analogy, but you get the point).
So, ask yourself – for every customer that you are winning, do you know how many you are losing? Or better yet, do you know the impact these lost customers had on your bottom line?
It’s all in the data
Customer data – our greatest asset. So powerful, yet so neglected.
Each and every one of your customers is on their own journey with your brand, they want different things, they want to purchase differently, they have different expectations. It’s your job to keep up with the customer (not vice versa). Data enables you to do exactly that (and more!). Every time your customer makes a transaction with your brand, they are revealing more and more about the type of person they are. Learn more on how to make the most of your customer data here.
It’s time to start leveraging it!
A challenge you may face is data disarray. Many brands use several different platforms to track, monitor and measure customer engagement and transactional data. Your POS may not talk to your CDP and vice versa. It can seem daunting, with many marketers not knowing where to start to get a clear single customer view. API data integration is actually a lot easier than you think, so if your data is currently a little ‘all over the place’, we recommend data integration as the first step. Get a single customer view for accuracy.
Tracking customer behaviour over time
To get a clear view of how your customers are behaving, we recommend looking at data from a specific time period. It depends on what industry you are in, but typically we would look at 12-24 months worth of data and benchmark from start to end. You can go fairly deep with data analysis here, but if you don’t have inhouse expertise – you could look at the RFM model (Recency, Frequency and Monetary value). Even by understanding how frequently your customers shopped with you, how recent and how much they typically spend – you can get a clear picture of where they are in the customer lifecycle. Below is an example of Customology’s waterfall analysis.
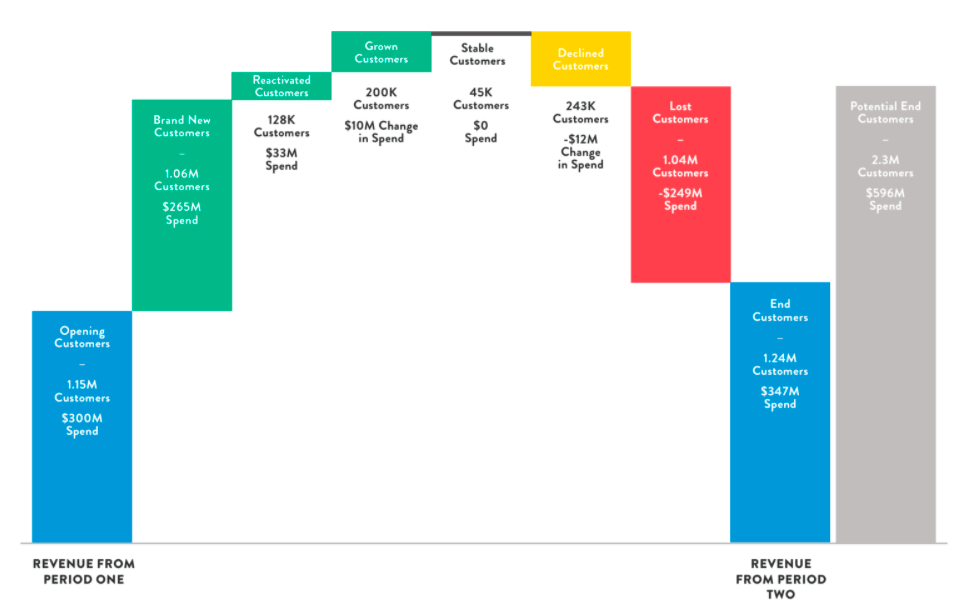
Benchmarking revenue from period one to period two looks fairly positive – the brand has achieved growth, yet when you look at the specific behaviour of their customers between the two periods – you see a different story. They acquired lots of new customers, which was great – however, on the flip side – they lost almost as many existing customers. Also, 243K customers are spending less (putting them at a high churn risk). Just look at what was possible (from a revenue perspective) if they didn’t lose any customers. $596m revenue vs. $347m – that’s quite a difference!
Think of the types of marketing communications you send to your customers. How personalised are they really? If you knew which of your customers fell into these various customer groups – would you send the same message to them? No, we thought not. Each is at completely different stages and needs a different conversation, initiative, reward etc.
Look for early indicators to prevent customer churn and drive customer loyalty
It’s so important to know exactly where your customers are in the lifecycle. The waterfall analysis is just one example, with quality data you can conduct effective customer behavioural segmentation, customer indexing and propensity analysis – determining what products/services your customers are likely to be most interested in, so you can market to them much more effectively.
You will get visibility of any customers who are at risk of churning, giving you the opportunity to prevent the churn, enable the customer along the path to repurchase and ultimately, drive loyalty (not churn).
If you’re unsure where to start, contact us on 1300 264 549 or hi@customology.com.au to discuss our Customer Growth Analysis. We can help you integrate and clean your customer data (through multiple technologies), giving you a clear customer view. We can also reveal exactly how your customers are behaving and help you put them on a path to repurchase.
|
Listen to...
 |